
Authors: Grosomanidis V1 MD, PhD, Veroniki F1 MD, PhD, Fyntanidou B1 MD, PhD, Tsiapakidou S2 MD, Kyparissa M1 MD, PhD, Kazakos G3 DVM, PhD, Lolakos K1 MD, Kotzampassi K4 MD, PhD.
1 Clinic of Anesthesiology and Intensive Care, School of Medicine, Aristotle University of Thessaloniki, AHEPA Hospital, Thessaloniki, Greece.
2 1st Department of Obstetrics and Gynecology, Aristotle University of Thessaloniki, Papageorgiou General Hospital Thessaloniki, Greece.
3 Companion Animal clinic, School of Veterinary Medicine, Faculty of Health Sciences, Aristotle University of Thessaloniki.
4 Department of Surgery, Aristotle University of Thessaloniki, AHEPA Hospital, Thessaloniki, Greece.
Abstract
Increased IAP often coexists with sepsis in severely ill patients in the ICU, under mechanical ventilation and pharmaceutical support of the circulation with inotropes and vasoactive drugs. Both conditions have an unfavorable effect on the cardiovascular system. The purpose of this experimental study was to record the effect of increased intra-abdominal pressure on the cardiovascular system of pigs, with or without additional sepsis. Sixteen male pigs were randomly assigned in two groups A and B. In both groups, after induction to anesthesia and mechanical ventilation, the intra-abdominal pressure was increased to 25mmHg by helium insufflation in the peritoneal cavity, and that level of IAP was preserved until the end of the experiment. In Group A no other intervention apart from the increase in IAP was made, whereas in Group B, 60 minutes after the increase in IAP, 100μg/kg LPS were administered. Data were recorded after induction of anesthesia and initiation of mechanical ventilation (baseline measurement/measurement 0) and thereafter every 20 min after intra-abdominal pressure increase. The last measurement (measurement 9) was obtained immediately before release of pneumoperitoneum. Parameters measured or calculated included HR, BP(s,d,m), RVPs, PAP(s,d,m), PΑWP, CO, SV, SVR, PVR, SvO2, ETCO2. HR increased statistically significantly only in Group B, 60 minutes after the administration of LPS. BP (s, d, m) presented a significant change only in Group B, an initial increase immediately after LPS administration, followed by a decrease. CVP, RVPs and PAP (s, d, m) increased in both groups after IAP increase, whereas they presented an additional increase in Group B, after LPS administration. PΑWP changed only in Group B, after LPS administration. CO and SV were dramatically reduced in Group B, immediately after LPS administration, but gradually recovered their initial values until the end of the experiment. SVR changed only in Group B. They increased after LPS administration and then they gradually decreased. PVR increased dramatically after LPS administration and, despite gradual decrease they remained at high values until the end of the experiment. SvO2 decreased in Group B after LPS administration but gradually recovered its initial values. At the conditions of this particular experiment, the increase in intra-abdominal pressure was well tolerated by the laboratory animals. On the contrary, sepsis induction by LPS administration had an unfavorable effect on the cardiovascular system.
INTRODUCTION
Patients with intra-abdominal hypertension and abdominal compartment syndrome and patients with sepsis are considered severely ill and should be hospitalized in the Intensive Care Unit, in order to survive, since they are in need for mechanical ventilatory support and circulatory support with inotropic and vasoactive drugs. Sepsis itself is a cause of ICU admission, but it may also occur during ICU stay.
Septic patients often present with abdominal hypertension, but on the other hand the increase of intraperitoneal pressure could also predispose to sepsis. The combination of sepsis with abdominal hypertension is not rare in critically ill patients in the ICU.
Sepsis and abdominal hypertension on their own have unfavorable consequences in many organs and systems. Their effect on the circulatory system is considered a fact and often determines the prognosis.
The purpose of this experimental study was to evaluate the effects of abdominal hypertension alone, or in combination with sepsis, on the circulatory system of pigs.
Abdominal pressure-abdominal hypertension-abdominal compartment syndrome
According to the World Society of the Abdominal Compartment Syndrome (WSACS) Intra-abdominal hypertension – IAH is considered the increase of Ιntra-Αbdominal Pressure – ΙAP over 12mmHg. According to the level of IAP, Intra-Abdominal Hypertension is ranked in categories I – IV. Class Ι – IAP: 12 – 15mmHg, Class II – IAP: 16 – 20mmHg, Class III – IAP: 21 – 25mmHg and Class IV – IAP: >25mmHg. An increase in IAP of more than 20mmHg with a single organ deficiency is considered Abdominal Compartment Syndrome1-3.
Sepsis
Sepsis is defined as a life threatening organ dysfunction which is the result of the body’s reaction to inflammation4-7. Septic shock is the clinical condition which is characterized by circulatory and cellular/metabolic dysfunction and results to greater mortality. The term sepsis existed in the ancient Greek literature and was used by Galinos in his writings, where he described the clinical signs of inflammation.
The first modern definition of sepsis was published in 1992 and was the result of a consensus conference of the American College of Chest Physicians and the Society of Critical Care Medicine in 1991. During that consensus the term Systemic Inflammatory Response Syndrome (SIRS) was introduced to describe the body’s primary response to injury, which may be infective or non-infective8. At that consensus it was assumed that SIRS is triggered by local or systemic inflammation, like trauma, burn, surgical operation or pathologic conditions like acute pancreatitis. Since then, guidelines are being published every several years for the timely recognition and treatment of sepsis4-6,9,10. Today sepsis is recognized as an important health issue, which affects millions of people around the world and is associated with great costs and high mortality rates4,11-14.
The effects of intra-abdominal pressure on the circulatory system
IAP has unfavorable effects on all organs and systems inside and outside the peritoneal cavity. The circulatory system is the main system which is affected by the increase of intra-abdominal pressure. In the early years it was believed that after IAP increase, death occurs due to respiratory failure. The inability to mechanically support patients’ breathing contributed to that false belief. Emerson was the first to prove in 1911, in an experimental study on cats, dogs and rabbits, that collapse of the circulatory system is responsible for the death of patients with an increase of intra-abdominal pressure and he reversed the existing at time belief that respiratory failure is the reason for patients’ death 15.
This negative effect of intra-abdominal pressure on the circulatory system becomes visible even at levels as low as 10-15mmHg16-17. The increase of intra-abdominal pressure affects negatively preload, afterload, systemic and pulmonary vascular resistances, stroke volume and cardiac output18-20.
The cephalic shift of the diaphragm due to the increase of intra-abdominal pressure results in an increase in intra-thoracic pressure. Clinical and experimental studies have shown that 20-80% of IAP is transmitted to the thorax21.
Intra-thoracic pressure increase results to venous return decrease, whose magnitude depends on the level of pressure, the volume status and the application of mechanical ventilation. Intra-abdominal and intra-thoracic pressure increase causes compression of superior vena cava, inferior vena cava and portal vein, resulting in reduction of venous return, preload and cardiac output22. The preload reduction is the main effect of the intra-abdominal pressure increase and its magnitude depends on the pressure level.
The second main parameter affected by the increase in intra-abdominal pressure is afterload, which increases. This increase is attributed to the increase in systemic vascular resistances, mainly because of the compression of large vessels within the abdomen and the thorax17-23.
After experimental and clinical studies it became known that IAH and ACS directly affect the heart’s contractility, due to the increase in intra-thoracic pressure caused by the cephalic diaphragm shift24-25. Both ventricular compliance and end-diastolic volume are reduced, while the Frank-Starling curve is shifted to the right. Liu et al described histological and morphological damage in an experimental model of IAH26, while Huetteman et al recorded disturbances in the movement of the interventricular septum during pneumoperitoneum in 8 pediatric patients, who underwent laparoscopic hernia repair27.
The effects of sepsis on the circulatory system
The clinical effects of sepsis on the circulatory system become apparent even at its early stages and play a key role in patients’ final outcome28-29.
Physicians in the Intensive Care Units are for many years aware of the fact that, even though some patients with sepsis develop multi-organ failure, most of them die in the early stages of the disease due to persistent hypotension and circulatory collapse because of the septic shock. Technological evolution, by the use of the pulmonary artery catheter and recently by the routine use of echocardiography when managing hemodynamically unstable ICU patients, enabled better understanding of pathophysiological mechanisms and therefore better treatment.
At first, two different types of shock were described, each with a different cardiovascular profile. Clinical manifestations of the most typical type of septic shock are warm periphery, dry skin and galloping rhythm, which led to the name “warm shock”. Hemodynamic manifestations include reduced systemic vascular resistances, tachycardia with normal stroke volume and therefore it is considered a hyper-dynamic shock.
On the other hand, clinical manifestations of cold shock are signs of circulatory insufficiency, wet and cold skin, threading pulse and hypotension and this is considered a hypo-dynamic shock30.
It was believed that all patients were in a hyper-dynamic state at the beginning of sepsis, while on the course of the disease either they recovered or they ended up in a state of shock before they died. Those beliefs were based on certain clinical reports which supported that, in most cases of septic shock this is combined with low cardiac output and increased systemic vascular resistances31-32.
Clinical and experimental studies have proven that the hyper-dynamic state depends on the volume status of each patient, whereas in case of existing hypotension and low cardiac output the condition may be reversed with aggressive fluid administration33-35.
Despite understanding of many pathophysiological mechanisms, a commonly accepted definition of this unfavorable effect of sepsis on myocardium and the circulatory system does not exist. The term cardiomyopathy is often used to describe the global (systolic and diastolic) but reversible dysfunction of the left and right ventricle36-37.
The effects of mechanical ventilation on the circulatory system
The observation that both spontaneous breathing and positive pressure mechanical ventilation may affect the respiratory system dates quite back. The basic principles of heart-lung interactions are the following: a. spontaneous respiration requires energy, b. during inspiration, pulmonary volumes are increased above functional residual capacity, therefore certain hemodynamic consequences may be attributed to the changes in pulmonary volumes and the chest wall expansion, and c. spontaneous breathing reduces intrathoracic pressure while positive pressure ventilation increases it. Therefore, the difference between spontaneous breathing and positive pressure ventilation mainly reflects the difference between the changes in intrathoracic pressure (ITP) and the energy required for them. The changes in ITP may affect cardiac output by altering the pressure gradient both for the venous return from the periphery to the right ventricle and for the pumping of blood from the left ventricle to the aorta. ITP increase reduces the pressure gradient while its reduction has the opposite consequences. This effect is related to the time when the ITP change occurs and the pre-existing status of the cardiovascular system. Pinsky et al, based on the results of repeated clinical and experimental studies, believe that in clinical conditions, where the contractility of the left ventricle is reduced, ITP increase results in cardiac output increase38-42.
Under normal conditions, during spontaneous breathing, ITP becomes negative during inspiration, whereas it tends to become positive during expiration. However, during mechanical ventilation, ITP becomes more positive during inspiration and then is reduced during expiration, but it never becomes negative. Pulmonary volumes change accordingly. During a respiratory cycle of several seconds duration, a certain number of cardiac cycles take place.
Some of them coincide with the phase of inspiration while others with the phase of expiration. Due to the short duration of each cardiac cycle it is impossible for two consecutive cardiac cycles to take place under the same conditions of intrathoracic pressure.
Since venous return and pumping of blood from the left ventricle do not occur at the same time during the cardiac cycle, we could differentiate between the effects of intrathoracic pressure on the venous return and on the pumping of the left ventricle. In every cardiac cycle, the effect of ventilation is different, depending on the phase of the respiratory cycle (inspiration-expiration) when the cardiac cycle takes place. The maximum reinforcement of the pump function of the left ventricle occurs when the increase in ITP takes place in the phase of systole, especially in patients with impaired contractility, a favorable effect which is applied in the treatment of patients with acute pulmonary edema43. On the contrary, maximum reduction in venous return occurs when the increase in ITP takes place during the phase of diastole, especially in patients with reduced intravascular volume. ITP reduction during spontaneous breathing inspiration increases venous return and the right heart receives more blood, which is pumped out to the pulmonary circulation, whose capacity has increased due to the increase in pulmonary volumes44. The left ventricle is filled with a smaller amount of blood because its venous return is reduced due to the overfilled right heart, which shifts the interventricular septum backwards and downwards, thus limiting the available space for the expansion of the left ventricle. Moreover, the intrathoracic part of the aorta, which actively participates in the pumping of blood, presents an increase in its overall resistance and a reduction in its contractility, due to the negative pressure in the inspiration phase. These result in aorta transmural pressure increase and increased work of the left ventricle in order to pump out blood to the periphery. Clinical conditions with large negative changes in ITP, like patients with airway obstruction (during recovery from general anesthesia) or patients fighting the ventilator (during weaning from mechanical ventilation) could possibly lead to acute pulmonary edema and death, even in patients with normal cardiac function45.
Materials and Methods
The experiments took place at the experimental operating room of AHEPA University Hospital after obtaining permission from the Head of Veterinary Department of Thessaloniki. The study included 16 male Landrace pigs, 3 months old and of 25Kg weight. The pigs were divided into two groups of 8: Group A (Control Group) and Group B (Sepsis Group).
Anesthesia was induced with intravenous thiopental 10mg/kg BW, fentanyl 5μg/Kg BW and vecuronium 0.3μg/Kg, while anesthesia was maintained with continuous intravenous infusion of midazolam at a dose of 1-2mg/kg/hr and vecuronium at a dose of 2mg/kg/hr. Incremental administration of anesthetic agents and muscle relaxants was administered as needed. During the painful stages of surgical preparation and vascular catheters insertion additional fentanyl (0.1-0.2mg) was administered. The airway was secured with surgical tracheostomy and mechanical ventilation was applied with an ICU ventilator (Ceasar Ventilator, Taema-Air Liquide).
During all phases of the study, animals were mechanically ventilated under general anesthesia and paralysis. Mechanical ventilation settings were: Tidal Volume (Vt): 10-12ml/kg BW and respiratory rate (RR): 10-14/min, aiming at normocapnia (ETCO2: 35-45mmHg).
Monitoring included 3-lead ECG recording, direct measurement of systemic arterial pressure through the femoral artery and central pressure measurements through the pulmonary artery catheter, with continuous measurement of cardiac output and mixed venous oxygen saturation (OptiQ | Pulmonary Artery SvO2 / CCO Catheter).
After anesthesia induction, application of mechanical ventilation and appropriate monitoring, and standard measurements recording, intraperitoneal pressure was increased by helium insufflation into the peritoneal cavity via laparoscopic surgery equipment. Helium was chosen for application of pneumoperitoneum in order to avoid the effects of CO2 on the circulatory system and mainly on the pulmonary circulation. In Group A, apart from the increase of intra-abdominal pressure no other intervention was performed, whereas in Group B, 60 minutes after increase of intra-abdominal pressure sepsis was induced. The induction of sepsis was performed by the administration of endotoxin (Lipopolysaccharides-LPS) through the pulmonary artery catheter into the right atrium at a dose of 100μg/Kg within 20 minutes, by the use of an electronic infusion pump. Hemodynamic stability, which was assessed by hemodynamic measurements obtained at regular time points, was maintained by administration of crystalloid solution Ringer Lactate. No inotropic or vasoactive agents were administered in order not to interfere with the study protocol, whereas intravenous fluid administration was restricted to crystalloids aiming to maintain viability of the laboratory animals throughout the experiment. Data were recorded after induction of anesthesia and initiation of mechanical ventilation (baseline measurement/measurement 0) and thereafter every 20min after intraperitoneal pressure increase. The last measurement (measurement 9) was obtained immediately after release of pneumoperitoneum.
The timetable of recordings and the conditions at which each measurement was obtained are depicted in Table 1.
Table 1. Conditions of the experiment at each time point of data recording
| Phases of measurements |
Time intervals after initial measurement (min) |
CONDITIONS OF THE EXPERIMENT |
|
| GROUP A | GROUP B | ||
| 0 | 0 | Initial IAP = 0 | Initial IAP = 0 |
| 1 | 20 | IAP = 25 mmHg | IAP = 25 mmHg |
| 2 | 40 | IAP = 25 mmHg | IAP = 25 mmHg |
| 3 | 60 | IAP = 25 mmHg | IAP = 25 mmHg |
| Infusion LPS | |||
| 4 | 80 | IAP = 25 mmHg | SEPSIS – IAP = 25 mmHg |
| 5 | 100 | IAP = 25 mmHg | SEPSIS – IAP = 25 mmHg |
| 6 | 120 | IAP = 25 mmHg | SEPSIS – IAP = 25 mmHg |
| 7 | 140 | IAP = 25 mmHg | SEPSIS – IAP = 25 mmHg |
| 8 | 160 | IAP = 25 mmHg | SEPSIS – IAP = 25 mmHg |
| 9 | 180 | Release of pneumoperitoneum | Release of pneumoperitoneum |
Parameters measured or calculated included:
- Heart rate – HR
- Systolic arterial pressure – BPs
- Diastolic arterial pressure – BPd
- Mean arterial pressure – BPm
- Right ventricle systolic pressure – RVPs
- Systolic pulmonary artery pressure PAPs
- Diastolic pulmonary artery pressure PAPd
- Mean pulmonary artery pressure PAPm
- Pulmonary artery wedge pressure – PAWP
- Cardiac output – CO
- Stroke volume – SV
- Systemic vascular resistances – SVR
- Pulmonary vascular resistances – PVR
- Mixed venous oxygen saturation – SvO2
- End-tidal carbon dioxide – ETCO2
After the end of the experiment, euthanasia was performed to the laboratory animals by intravenous administration of 500mg thiopental and 20ml KCl 10%.
The statistical program SPSS 22 was applied for statistical processing of the measurements. Normal distribution was assessed by Colmogorof-Smirnof testing. ANOVA test for repeated measurements was used to compare values between groups and between measurements.
RESULTS
Heart rate did not change significantly after the increase of intra-abdominal pressure in any of the groups, but it presented a statistically significant increase in Group B (compared both to initial measurement in Group B and in Group A) after administration of the LPS, an effect which remained throughout the experiment. Statistically significant differences between groups were recorded at phase 6 of the measurement (p<0.05), phase 7 (p<0.01), phase 8 (p<0.001) and 9 (p<0.01) (Table 2).
Systolic, diastolic and mean arterial pressure did not change in Group A compared to initial measurement throughout the experiment. On the contrary, in Group B, after the administration of LPS, these values presented an initial increase followed by a gradual decrease later on. Statistically significant differences between groups were recorded at time 4 of the measurement (p<0.01), phase 7 (p<0.01), and phases 8-9 (p<0.05) (Table 2).
Table 2. HR and BP (Systolic, Diastolic and Mean) changes during study
| Phases of measurements |
HR Mean ± SD b/min |
BP systolic Mean ± SD mmHg |
BP diastolic Mean ± SD mmHg |
BP mean Mean ± SD mmHg |
||||
| GROUP | GROUP | GROUP | GROUP | |||||
| A | B | A | B | A | B | A | B | |
| 0 | 99,7± 9,5 | 109,1±9,1 | 160,6±23,7 | 174,2±7,8 | 104,2±13,3 | 110,5±8,1 | 119,2±16,5 | 131,7±6,9 |
| 1 | 102,5±10,2 | 114,7±3,5 | 170±21,5 | 175±11,2 | 105,4±9,3 | 113,5±7,9 | 126,9±13,3 | 134±7,8 |
| 2 | 109,2±11,3 | 117,6± 3,5 | 167,1±18,7 | 175,9±11,3 | 105,6±6 | 106,4±5 | 126,1±9,9 | 133,8±6,2 |
| 3 | 110,6±12 | 114,9 ±10,1 | 166,6±19,3 | 173±14,1 | 105,2±3,4 | 111,5±8,6 | 125,7±7,9 | 132±9,7 |
| 4 | 103,2±11,8 | 113±9,9 | 165,2±12,7 | 189,5±12,6* | 105,6±5,4 | 122,5±12,1 | 125,5±4,5 | 139,3±11,2 |
| 5 | 105,4±12,3 | 112,2±10,8 | 171,6±19,2 | 174,7±15,9 | 106,2±6,9 | 111,1±12,1 | 128,1±9,9 | 132,311,6 |
| 6 | 106,1±9,6 | 123,2±7,9** | 174,9±14,6 | 163,2±17,5 | 107,5±8,1 | 102,5±13,2 | 129,3±7,3 | 122,7±13 |
| 7 | 107,1±10,5 | 126,4±8,3** | 172,5±19,8 | 149,4±20,9** | 107,2±5,9 | 90,7±15,5** | 129±9,6 | 110,3±16** |
| 8 | 99,2±7,8 | 128,1±9,5** | 170± 11,5 | 151±18** | 110±9,6 | 89,2±12,8** | 129,1±9,6 | 109,8±12,8** |
| 9 | 104,7±9,9 | 117,6±9,3 | 172,2±13,4 | 151±15,8** | 108,5±5,7 | 87,7±15,4** | 129,3±13,2 | 108,8±13,2** |
| Compared to initial measurement *p<0,05, **p<0,01 | ||||||||
Central venous pressure as expected was statistically significantly increased in both groups after helium insufflations in the peritoneal cavity and the increase of intra-abdominal pressure. In Group B, central venous pressure was increased even more after the administration of LPS. Statistically significant differences between groups were recorded at time 4 of the measurement (p<0.01), phase 5 (p<0.001), phases 6-7 (p<0.01) and phase 8 (p<0.05) (Table 3, Figure 1).
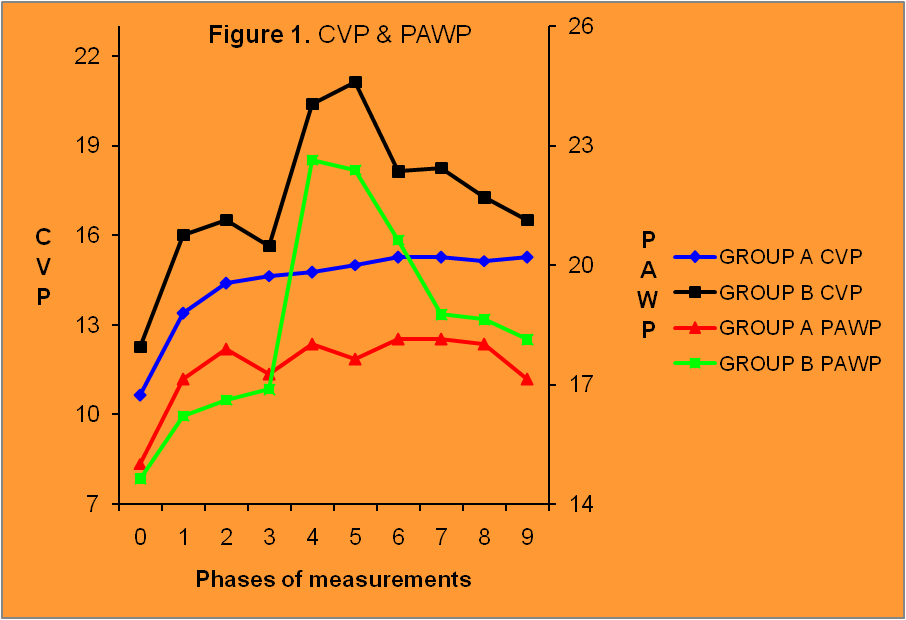
Figure1. Changes in CVP and PAWP. Phase 1 after increase in IAP, phase 5 after LPS admin-istration and phase 9 after pneumoperitoneum release.
Systolic pressure in pulmonary artery presented a significant change both in control group and sepsis group. Comparison of measurements between two groups were statistically significantly different at phases 4-5 (p<0.001) and 6-7 (p<0.05) (Table 3, Figure 2).

Figure 2. Changes in PAPs and RVPs. Dramatical increase of pressures after LPS administration. Phase 1 after intra-abdominal pressure increase, phase 5 after LPS administration and phase 9 after pneumoperitoneum release.
Diastolic pressure in pulmonary artery also presented a statistically significant increase in both groups after the increase of intra-abdominal pressure and it remained high until the end of the experiment. Comparison of measurements between groups revealed a statistically significant difference at phases 3-6 (p<0.001) and phase 7 (p<0.05) (Table 3).
Mean pulmonary artery pressure, as a derivative parameter, changed significantly both in control group and sepsis group. Comparison of measurements between groups revealed a statistically significant increase at phases 4-6 (p<0.001), 7 (p<0.01) and 8 (p<0.05). (Table 3).
Table 3. CVP and PAP (Systolic, Diastolic and Mean) changes during study
| Phases of measurements |
CVP Mean ± SD mmHg |
PAP systolic Mean ± SD mmHg |
PAP diastolic Mean ± SD mmHg |
PAP mea Mean ± SD mmHg |
||||
| GROUP | GROUP | GROUP | GROUP | |||||
| A | B | A | B | A | B | A | B | |
| 0 | 10,6±1,2 | 12,2±2 | 35,4±10,4 | 36±7,6 | 18,5±2,1 | 20±4,2 | 24,1±3,6 | 25,3±4,7 |
| 1 | 13,4±1,5** | 16±1,3** | 39,3±5,4 | 42,3±6,9 | 20,1±2,9 | 20,5±5,4 | 26,5±2,7 | 27,7±5,3 |
| 2 | 14,4±1,8** | 16,5±1,7** | 39,8±7,2 | 43,5±10,8 | 20±4,4 | 22,6±6,1 | 27,4±3,8* | 29,6±7,2 |
| 3 | 14,6±2,1** | 15,6±1,8** | 43,5±9,7* | 44,5±8,5** | 21,5±3,7 | 25,5±5,8 | 28,8±4,5* | 31,5±6,2 |
| 4 | 14,8±1,9** | 20,4±3,5** | 43,4±8,2* | 76,7±13,3** | 22,1±3,9 | 47,9±4,6** | 28,8±4,5** | 57,5±7** |
| 5 | 15±1,4** | 21,1±2,2** | 44,9±7,5** | 69±11,4** | 21,9±3,2 | 45,1±8,9** | 29,5±3,9** | 53,8±9** |
| 6 | 15,3±1,4** | 18,1±1,6** | 44,2±7,1* | 55±11** | 23±3,7* | 35,4±6,2** | 29,6±3,8** | 41,9±7,6** |
| 7 | 15,3±1,8** | 18,3±1,8** | 44,1±6,1* | 51,6±9,5** | 22,6±2,1* | 33±6,6** | 29,2±3** | 39,2±7** |
| 8 | 15,1±2** | 17,3±1,7** | 45,2±7,3** | 52,2±9,9** | 23,9±4,6** | 33,1±8,1** | 31±5** | 39,5±8,6** |
| 9 | 15,3±2** | 16,5±2,4** | 41,9±7,1 | 49,1±12,7* | 23,6±3,9* | 29,7±7,7** | 29,7±4,7** | 36,2±9,4** |
| Compared to initial measurement *p<0,05, **p<0,01 | ||||||||
Pulmonary artery wedge pressure changed significantly only in the sepsis group. Comparison of measurements between groups revealed statistically significant increase in Group B at phases 4-5(p<0.01) (Table 4, Figure 1).
Right ventricle systolic pressure increased statistically significantly after the increase of intra-abdominal pressure and remained increased until the end of the experiment. In Group B it increased further more after LPS administration. Statistically significant differences between groups were recorded at phases 4-5 (p<0.001) and 6 (p<0.05) (Table 4, Figure 2).
Cardiac output remained unchanged in control group, whereas it was significantly reduced in sepsis group after the administration of endotoxin. Comparison of measurements between the two groups revealed statistically significant difference at phases 4-5 (p<0.001) (Table 4, Figure 3).
Stroke volume remained unchanged in control group, but was significantly decreased in the sepsis group after the administration of LPS. Comparison of measurements between the two groups revealed statistically significant difference at phases 4-5 (p<0.001) and phase 6 (p<0.05) (Table 4, Figure 3).
Table 4. PCWP , RVPs, CO, SV changes during study
| Phases of measurements | PAWP Mean ± SD mmHg |
RVP systolic Mean ± SD mmHg |
CO Mean ± SD L/min |
SV Mean ± SD ml |
||||
| GROUP | GROUP | GROUP | GROUP | |||||
| A | B | A | B | A | B | A | B | |
| 0 | 15±3,3 | 14,6±1,6 | 36,7±12,3 | 36,1±7,6 | 3,2±0,2 | 3,6±0,9 | 32,3±5,5 | 32,8±8,9 |
| 1 | 17,1±3,4 | 15,7±1,9 | 43,2±6,2* | 44,1±6,9* | 2,95±0,3 | 3,2±1,1 | 28,5±5,2 | 27,6±9,8 |
| 2 | 17,9±3,3 | 15±2,1 | 43,4±6,8* | 43,8±10,8* | 2,93±0,3 | 2,9±0,8 | 26,8±4,4 | 24,8±7,9 |
| 3 | 17,2±2,8 | 16,9±2,7** | 44,5±8,7** | 44,6±8,5* | 2,97±0,2 | 2,9±0,8 | 26,8±5,4 | 25,4±7,8 |
| 4 | 18,1±2,5 | 22,6±2,3** | 44,7±7,8* | 82,2±13,3** | 2,96±0,2 | 1,6±0,5*** | 28,6±6,1 | 14,1±5,2** |
| 5 | 17,6±3,2 | 22,4±2,8** | 46±7,3** | 75,2±11,4** | 3±0,2 | 1,4±0,6*** | 28,7±6 | 12,8±5,1** |
| 6 | 18,1±3,2 | 20,6±2,5** | 44,4±7,5* | 60,4± 11** | 3,1±0,4 | 2,7±0,8 | 29,5±4,9 | 22,3±5,8** |
| 7 | 18,1±3,2 | 18,7±2,5** | 44,9±6,5* | 56,7±9,5** | 3±0,3 | 3,5±1 | 28,2±2,9 | 27,5±9,1 |
| 8 | 18±2,8 | 18,6±2,9** | 47±7,8** | 55,7±9,9** | 3±0,3 | 3,3±0,8 | 30,2±3,3 | 26,5±5,1 |
| 9 | 17,2±3,2 | 18,1±3** | 44,7±7,1* | 53 ±12,7* | 2,9±0,2 | 3,1±0,6 | 27,9±3,4 | 26,6±5,4 |
| Compared to initial measurement *p<0,05, **p<0,01, ***p<0,001 | ||||||||

Figure 3. Changes in CO and SV. A small decrase after IAP increase and a significant decrease after LPS administration. Phase 1 after IAP increase, phase 5 after LPS administration and phase 9 after pneumoperitoneum release.
Systemic vascular resistances changed significantly only in the sepsis group. Comparison of measurements between the two groups revealed statistically significant difference at phases 4-5 (p<0.001) and phases 7-9 (p<0.05) (Table 5, Figure 4).
Pulmonary vascular resistances did not change significantly in Group A, but increased in Group B after the administration of LPS and remained increased until the end of the experiment. Comparison of measurements between the two groups revealed statistically significant difference at phases 4-5 (p<0.001), phase 6 (p<0.01) and phases 7-9 (p<0.05) (Table 5, Figure 4).

Figure 4. Changes in SVR and PVR. A very significant increase after LPS administration. Phase 1 after IAP increase, phase 5 after LPS administration and phase 9 after pneumoperitoneum release.
Mixed venous oxygen saturation, as measured through the pulmonary artery catheter did not change significantly in Group A. In Group B it was decreased after LPS administration and gradually returned to its initial values. Statistically significant difference was recorded at phases 4-5 (p<0.001) and phase 6 (p<0.01) (Table 5).Finally, end-tidal carbon dioxide did not change significantly in any group (Table 5).
Table 5. SVR, PVR, SvO2, ETCO2 changes during study
| Phases of measurements | SVR Mean ± SD (dyn.s/cm5) |
PVR Mean ± SD (dyn.s/cm5) |
SVO2 | ETCO2 mean (mmHg) |
||||
| GROUP | GROUP | GROUP | GROUP | |||||
| A | B | A | B | A | B | A | B | |
| 0 | 2356±438 | 2356±810 | 224±65 | 267±56 | 74,9±13,6 | 74,2±5,1 | 33,6±2,7 | 29,8±2,2 |
| 1 | 2694±604 | 2601±712 | 269±67 | 319±74 | 73,4±14,4 | 69,1±7,3 | 32,7±2,6 | 28,5±2,3 |
| 2 | 2669±448 | 2806±832 | 286±87 | 435±45 | 76,8±8,9 | 71,1±8,7 | 33,1±2,5 | 28±3,1 |
| 3 | 2618±415 | 2845±927 | 310±98 | 425±67 | 77,2±8,6 | 69,5±7,8 | 32,4±3,7 | 28,3±2,3 |
| 4 | 2619±342 | 5336±969** | 299±110 | 2097±125*** | 76,9±8 | 54,2±8,6** | 32,2±3,4 | 27±3,7 |
| 5 | 2682±453 | 5415±761** | 322±94 | 2109±210*** | 75,7±9,1 | 55,7±5,4** | 32,6±3,1 | 28,1±4,1 |
| 6 | 2600±434 | 2663±891 | 284±56 | 647±223** | 75,4±9,6 | 63,2±6,4** | 32,6±2,1 | 31,4±2,7 |
| 7 | 2654±512 | 1867±717* | 298±89 | 517±167** | 73,3±10,9 | 68,5±7,2 | 32,1±2,4 | 32,6±4,4 |
| 8 | 2675±407 | 1994±608* | 267±110 | 575±187** | 72,4±10,6 | 68,7±4,9 | 31,2±2,4 | 31,6±3,6 |
| 9 | 2757±456 | 2068±485* | 245±114 | 502±143** | 75,2±10,2 | 71,2±7,1 | 32,4±1,3 | 33,2±3,1 |
| Compared to initial measurement *p<0,05, **p<0,01, ***p<0,001 | ||||||||
Statistically significant differences between groups for each parameter at the same time of measurement are depicted in total on Table 6.
Table 6. Statistically significant differences between Group A and Group B at the same time of measurement.
| Phases of measurements | ||||||||||
| 0 | 1 | 2 | 3 | 4 | 5 | 6 | 7 | 8 | 9 | |
| HR | p<0,05 | p<0,01 | p<0,001 | p<0,05 | ||||||
| BPs | p<0,01 | p<0,05 | p<0,01 | p<0,01 | ||||||
| BPd | p<0,01 | p<0,05 | p<0,01 | p<0,01 | ||||||
| BPm | p<0,01 | p<0,05 | p<0,01 | p<0,01 | ||||||
| CVP | p<0,01 | p<0,001 | p<0,01 | p<0,01 | p<0,05 | |||||
| RVPs | p<0,001 | p<0,001 | p<0,05 | |||||||
| PAPs | p<0,001 | p<0,001 | p<0,05 | p<0,05 | ||||||
| PAPd | p<0,001 | p<0,001 | p<0,001 | p<0,001 | p<0,05 | |||||
| PAPm | p<0,001 | p<0,001 | p<0,001 | p<0,01 | p<0,05 | |||||
| PAWP | p<0,01 | p<0,01 | ||||||||
| CO | p<0,001 | p<0,001 | ||||||||
| SV | p<0,001 | p<0,001 | p<0,05 | |||||||
| SVR | p<0,001 | p<0,001 | p<0,05 | p<0,05 | p<0,05 | |||||
| PVR | p<0,001 | p<0,001 | p<0,01 | p<0,05 | p<0,05 | p<0,05 | ||||
| SvO2 | p<0,001 | p<0,001 | p<0,01 | |||||||
| ETCO2 | ||||||||||
Discussion
Patients in the ICU are severely ill and they are usually under mechanical ventilation and pharmaceutical support of the circulation with vasoactive drugs. Increased intra-abdominal pressure and sepsis are common clinical conditions in the ICU and they often co-exist.
The unfavorable effect of increased intra-abdominal pressure and sepsis on the cardiovascular system is quite well document in recent and older literature15-21, 28-37. In this experimental study we investigated the effect of intra-abdomimal pressure alone or in combination with sepsis on the cardiovascular system of pigs.
In this study, 16 male pigs of the Landrace race from the same producer were used. The laboratory animals were randomly assigned in two groups A and B, of eight pigs each. In both groups intra-abdominal pressure increased and remained stable at 25mmHg, by helium insufflation in the peritoneal cavity. In Group B, 60 minutes after pneumoperitoneum application, sepsis was induced by the administration of LPS in the right atrium.
The use of laparoscopic surgery equipment to induce pneumoperitoneum ensured the preservation of IAP at a stable level of 25mmHg throughout the experiment, whereas the use of helium prevented the adverse effects of CO2 on the circulatory system46,47.
The intravenous administration of LPS, at a dose of 100μg/kg, through the pulmonary artery catheter into the right atrium was used to induce sepsis. LPS administration is one of the common sepsis models used and the dose of 100μg/kg is based on the existing literature48,49.
The cardiovascular system’s response to the IAP increase, during pneumoperitoneum induction, consists of a slight increase in heart rate and systemic arterial pressure, a decrease in cardiac output and increase in systemic vascular resistances. This reaction is attributed to the increase of IAP, the CO2, the position and the release of catecholamines50-56.
In this present study, the increase of intra-abdominal pressure by helium insufflations did not change significantly the heart rate in any group. In Group B, one hour after LPS administration, a statistically significant increase in heart rate was recorded and remained so until the end of the experiment. Pneumoperitoneum application by the use of helium and the use of drugs (opioids) acting on the autonomous nervous system prevented the increase in heart rate after the increase of IAP.
Sixty minutes after LPS administration in Group B, as sepsis evolved, the heart rate increased significantly and remained increased until the end of the experiment. For the same reason, systemic arterial pressure (systolic, diastolic and mean) did not increase significantly in any of the groups, after the increase of IAP. LPS administration in Group B initially caused an increase in BP, followed by a gradual decrease.
Despite initial increase in systemic arterial pressure observed during pneumoperitoneum induction, the cardiac output is decreased even at low levels of IAP used during laparoscopic surgery. An increase in IAP at the level of 12mmHg causes a decrease in cardiac output17,57,58. This effect of IAP on CO may be counteracted by fluid administration and the CO recovers to its initial values after pneumoperitoneum release59,60.
The increase of IAP to 25mmHg by helium insufflation reduced cardiac output in both groups, but not to the level of statistical significance compared to the initial measurement. Appropriate hydration of the animals prevented a significant decrease in cardiac output. After the administration of LPS, CO was drastically reduced in Group B, but gradually returned to its initial values.
In the past, the opinion that the cardiovascular system’s response to sepsis may be hyperdynamic or hypodynamic existed30, an opinion which was revised after the use of the pulmonary artery catheter. These terms are no longer used, since it has been proven that, in the initial stages of sepsis, a hypodynamic condition prevails in hypovolemic patients61.
CO measurement was continuous by the use of PAC, while SV was calculated by the equation SV=CO/HR and, as expected, followed the changes of these parameters.
The combination of intra-abdominal hypertension and sepsis had a synergistic action in reducing cardiac output and systemic arterial pressure, an effect that would be greater if the time limits of this study were not restricted. Fluid administration may be life saving in the initial stages of sepsis, but after early resuscitation, aggressive fluid administration does not manage to further improve perfusion and may prove to be detrimental.
Hemodynamic stability preservation in septic patients often requires vasoactive drugs administration which, according to the initial study plan, were not used. According to older and current guideline4,9 , norepinephrine is considered the drug of choice for the septic patient’s support, while many studies suggest goal-directed fluid administration63.
Central venous pressure values (CVP, PAP, RVP and PAWP)64,65, are affected by many parameters like cardiac function, fluid administration, mechanical ventilation, intrathoracic and pericardial pressures. An increase in IAP results in an increase in intrathoracic pressures, since an important part of it is transferred in the thoracic cavity through the diaphragm translocation21. Since central pressures are measured within the thoracic cavity, every parameter that increases the pressures in the thorax will also increase central pressures variably. This increase in central pressures which is attributed to the increase in IAP is fictitious and by no means reflects the left or right ventricular preload60,65,66. For their more accurate calculation, in patients with IAH, correction with the following equation is suggested:
CVP corrected = CVP measured – (IAP/2).
In the present study, CVP and RVP increased significantly (compared to their initial value) in both groups as IAP increased and remained so until the end of the experiment. An additional, statistically significant increase compared to Group A was recorded in Group B after LPS administration.
The right ventricle ejects the blood that receives from the venous return to the pulmonary circulation, which under normal circumstances equals the cardiac output. As opposed to the left ventricle, the right ventricle ejects blood to a system of low pressure and high compliance67. Every pressure increase in the pulmonary circulation increases significantly the afterload of the right ventricle, which does not have the time to develop compensatory mechanisms and therefore fails. Although in the past, the role of the right ventricle in sepsis, pulmonary hypertension and the cardiac function in general was underestimated, it has become clear that the survival of patients with pulmonary hypertension depends on the right ventricular function71-73.
Central venous pressure equals RVEDP and the increase in CVP after LPS administration reflects an increase in RVEDP74,75.
Pulmonary artery pressure (systolic, diastolic and mean) increased along with the rest of the central pressures with the increase in IAP. LPS administration increased dramatically PAP (systolic, diastolic and mean), a response that was sustained although attenuated until the end of the experiment.
Pulmonary artery occlusion pressure increased but not to the level of statistical significance in both groups, after the increase in IAP. In Group B, PAOP increased significantly after LPS administration and remained significantly increased compared to its initial value throughout the experiment.
The increase in SVR which was observed in both groups with the increase in IAP was not statistically significant in any group. In Group B, SVR almost doubled after LPS administration, but through time they gradually decreased.
PVR presented similar behavior. They were not significantly affected by the increase in IAP, they increased dramatically in Group B after LPS administration and, despite gradual decrease, their value remained high until the end of the experiment.
From the values of PAP, PWOP and PVR it became apparent that LPS administration in Group B caused significant pulmonary hypertension76-79, which remained until the end of the experiment. Based on the diastolic pressure in PAP, on PAWP and on PVR it is assumed that the acute pulmonary hypertension recorded in Group B was combined pre- and post-capillary PH80-83.
Mixed venous oxygen saturation, which was measured through the pulmonary artery catheter, was reduced only in Group B after LPS administration and it gradually returned to its initial values.
It is well known that SvO2 represents the balance between oxygen delivery (DO2) and oxygen demand. Every decrease in delivery or increase in demand or both will reduce SvO2 values, thus depicting a global tissue hypoxia84-87.
Mechanical support of ventilation and helium use versus CO2 use contributed to the observed insignificant change in end tidal carbon dioxide value in both groups.
It seems that sepsis caused by LPS administration had an unfavorable effect both to the right and the left ventricle, an effect confirmed by the increase in CVP and PAOP and the reduction of SV, CO and SvO2. These findings confirm the existing knowledge that the cardiovascular system in sepsis is severely affected89-93.
The increase of intra-abdominal pressure at 25mmHg may have been an additional aggravating factor, but the lack of a third group without sepsis prevents us from talking with certainty about synergistic action of IAH and sepsis and from evaluating the effect of each particular clinical condition on the cardiovascular system.
Planning a new study with more groups and evaluating cardiac function by other means (echocardiography) apart from the pulmonary artery catheter would be useful in further investigation of the effect of these two clinical conditions that often coexist in the ICU.
Limitations of the study
In this experimental model, a model of sepsis induction by intravenous LPS administration to pigs was used. Sepsis induction by LPS administration is an acceptable experimental model but cannot mimic true sepsis in real patients. In order to measure central pressures and cardiac output we used the PAC, which enables us to measure pressure but not volume. Under conditions of increased intra-abdominal pressure, increased central pressures are affected to a variable degree by the increase of pressure in the thoracic cavity. The lack of a study group with sepsis only permits us from talking with certainty about possible synergistic action of increased intra-abdominal pressure and sepsis on the cardiovascular system. Furthermore, release of pneumoperitoneum was performed by disconnecting the laparoscopic equipment from the trocard and not by opening the peritoneal cavity as indicated in patients with Abdominal Compartment Syndrome.
CONCLUSIONS
From the findings of this study it seems that the increase of intra-abdominal pressure at 25mmHg by helium insufflation, despite the effect on measured parameters, was well tolerated by the laboratory animals.
Mechanical support of ventilation and volemia preservation attenuated the negative effects of increased IAP. LPS administration in Group B had an unfavorable effect both to the left and the right ventricle, which was recorded in the measured parameters. It seems that this unfavorable effect was mainly due to sepsis, since it did not improve by release of pneumoperitoneum.
References
- Malbrain M, Cheatham M, Kirkpatrick A, et al. Results from the International Conference of Experts on Intra-abdominal Hypertension and Abdominal Compartment Syndrome. I. Definitions. Intensive Care Med. 2006;32:1722-32.
- Cheatham M, Malbrain M, Kirkpatrick A, et al. Results from the International Conference of Experts on Intra-abdominal Hypertension and Abdominal Compartment Syndrome. II. Recommendations. Intens Care Med 2007;33:951-62.
- Kirkpatrick A, Roberts D, De Waele J et al. Intra-abdominal hypertension and the abdominal compartment syndrome: updated consensus definitions and clinical practice guidelines from the World Society of the Abdominal Compartment Syndrome. Intensive Care Med 2013;39:1190 -206.
- RhodesΑ, Evans L, Alhazzani W et al. Surviving Sepsis Campaign: International Guidelines for Management of Sepsis and Septic Shock: 2016. Intens Care Med 2017; 43 : 304 – 77.
- Singer M, Deutschman C, Seymour C et al: The Third International Consensus Definitions for Sepsis and Septic Shock (Sepsis-3). JAMA 2016; 315:801–810.
- Shankar-Hari M, Phillips G, Levy M et al; Sepsis Definitions Task Force: Developing a New Definition and Assessing New Clinical Criteria for Septic Shock: For the Third International Consensus Definitions for Sepsis and Septic Shock (Sepsis-3). JAMA 2016; 315:775–787
- Seymour C, Liu V, Iwashyna T et al: Assessment of Clinical Criteria for Sepsis: For the Third International Consensus Definitions for Sepsis and Septic Shock (Sepsis-3). JAMA 2016; 315:762–74.
- American College of Chest Physicians/Society of Critical Care Medicine Consensus Conference Committee. Definitions for sepsis and organ failure and guidelines for the use of innovative therapies in sepsis. Crit Care Med 1992;20:864 -74.
- Levy M Fink M, Marshall J et al. 2001 SCCM /ESICM /ACCP/ ATS/SIS International Sepsis Definitions Conference. Intensive Care Med 2003; 29:530–38.
- Dellinger RP, Levy MM, Rhodes A, et al: Surviving sepsis campaign: international guidelines for management of severe sepsis and septic shock: 2012. Crit Care Med 2013; 41:580−637.
- Fleischmann C, Scherag A, Adhikari N et al. Assessment of global incidence and mortality of hospital-treated sepsis. Current estimates and limitations. Am J Respir Crit Care Med 2016;193: 259 -72.
- Hershey T, Kahn J. State sepsis mandates—a new era for regulation of hospital quality. N Engl J Med [Internet]. 2017; 376:2311-2313.
- Gaieski D, Edwards J, Kallan M et al. Benchmarking the incidence and mortality of severe sepsis in the United States. Crit Care Med 2013; 41:1167-74.
- Mayr F, Talisa V, Balakumar V et al. Proportion and cost of unplanned 30-day readmissions after sepsis compared with other medical conditions. JAMA 2017; 317:530-31.
- Emerson H. Intra-abdominal pressures. Arch Intern Med. 1911;7:754–784.
- de Laet I, Malbrain M. Current insights in intra-abdominal hypertension and abdominal compartment syndrome. Med Intensiva 2007; 31: 88-99.
- Malbrain M, De Waele J, De Keulenaer What every ICU clinician needs to know about the cardiovascular effects caused by abdominal hypertension. Anesthesiology Intensive Therapy 2015; 47 : 388–399.
- Cheatham M, Malbrain M. Cardiovascular implications of elevated intra-abdominal pressure. In: Ivatury R, Cheatham M, Malbrain M, Sugrue M, editors. Abdominal compartment syndrome. Georgetown: Landes Bioscience; 2006. p. 89-104.
- De Waele J, De Lae I, Kirkpatrick A, Hoste E. Intra-abdominal Hypertension and Abdominal Compartment Syndrome. Am J Kidney Dis 2011 ; 57:159-169.
- Malbrain M, Ameloot K, Gillebert C, Cheatham M. Cardiopulmonary monitoring in intra-abdominal hypertension. Am Surg 2011; 77 : 23−30.
- Wauters J, Wilmer A, Valenza F. Abdomino-thoracic transmission during ACS: facts and figures. Acta Clin Belg 2007;5:200-5.
- Hayden P. Intra abdominal hypertension and the abdominal compartment syndrome. Current Anaesthesia & Critical Care 2007; 18 : 311–316.
- Saggi Β, Ivatury R, Sugerman S. Abdominal compartment syndrome. In Holzheimer R, Mannick J Surgical Treatment: Evidence-Based and Problem-Oriented. Munich: Zuckschwerdt; 2001.
- Cheatham M, Malbrain M. Cardiovascular implications of abdominal compartment syndrome. Acta Clin Belg Suppl 2007; 62: 98−112.
- Malbrain Μ, De laet Ι, De Waele J, Kirkpatrick A. Intra-abdominal hypertension: Definitions, monitoring, interpretation and management. Best Practice & Research Clinical Anaesthesiology 2013 ; 27 : 249–70.
- Liu D, Yu J, Fu X et al. Cardiac damage by intra-abdominal hypertension in a canine model. Int J Clin Exp Pathol 2016;9:996-1004
- Huettemann E, Sakka G, Petrat G, Schier F, Reinhart K. Left ventricular regional wall motion abnormalities during pneumoperitoneum in children. Br J Anaesth 2003; 90: 733 – 6.
- Gibot S, Levy B, Neviere R, Cariou A, Lesur O. Myocardial dysfunction and septic shock. Med Sci. 2004;20(12):1115-8.
- Parker MM, Shelhamer JH, Bacharach SL, et al. Profound but reversible myocardial depression in patients with septic shock. Ann Intern Med 1984;100:483–90.
- MacLean L, Mulligan WG, McLean APH, et al. Patterns of septic shock in man: A detailed study of 56 patients. Ann Surg 1967; 166 : 543– 62
- Clowes G, Vucinic M, Weidner M. Circulatory and metabolic alterations associated with survival or death in peritonitis. Ann Surg 1966; 163 : 844 – 66.
- Nishijima H, Weil M, Shubin H, et al. Hemodynamic and metabolic studies on shock associated with gram–negative bacteremia. Medicine 1973; 52 : 287 – 94.
- Parker S, Shelhamer J, Natanson C, et al. Serial cardiovascular variables in survivors and nonsurvivors of human septic shock: Heart rate as an early predictor of prognosis. Crit Care Med 1987; 15 : 923 – 29.
- Carroll G, Snyder J. Hyperdynamic severe intravascular sepsis depends on fluid administration in cynomolgus monkey. Am J Physiol 1982; 243 :131 – 41.
- Teule G, Den Hollander W, Bronsveld W, et al. Effect of volume loading and dopamine on hemodynamics and red cell distribution in canine endotoxic shock. Circ Shock 1983 ; 10 : 41 – 50.
- Hochstadt A, Meroz Y, Landesberg G. Myocardial dysfunction in severe sepsis and septic shock: more questions than answers? J Cardiothorac Vasc Anesth 2011; 25: 526–35.
- Antonucci Ε, Fiaccadori Ε, Donadello K et al. Myocardial depression in sepsis: From pathogenesis to clinical manifestations and treatment. Journal of Critical Care 2014 ; 29 : 500–511.
- Pinsky M, Summer W, Wise R et all. Augmentation of cardiac function by elevation of intrathoracic pressure. J Appl Physiol 1983; 54 : 950 – 55.
- Pinsky M, Summer W. Cardiac augmentation biphasic high intrathoraci pressure support in man. Chest 1983; 84 : 370 – 75.
- Pisky M, Matuschak G, Klain M. Determinants of cardiac augmentation by elevation of intrathoracic pressure. J Appl Physiol 1985; 58 : 1189 – 98.
- Pisky M, Matuschak G, Bernanti L, Klain M. Hemodynamic effects of cardiac cycle – specific increases in intrathoracic pressure. J Appl Physiol 1986; 60 : 604 – 12.
- Pinsky M, Marquez J, Martin D, Klain M. Ventricular assist by cardiac cycle – specific increases in intrathoracic pressure. Chest 1987;91 : 709 – 15.
- Rasanen J, Heikkila J, Downs J, et all. Continuous positive airway pressure by face mask in acute cardiogenic pulmonary edema. Am J Cardiol 1985; 55:296 – 300.
- Fessler H, Brower R, Wise R, Permutt S. Mechanism of reduced LV afterload by systolic and diastolic positive pleural pressure. J Appl Physiol 1988 ; 65 : 1244 – 50.
- Oswalt C, Gates G, Holstrom F. Pulmonary edema as a complication o acute upper airway obstruction. JAMA 1977; 238: 1833 – 35.
- Gutt C, Oniu T, Mehrabi A et al. Circulatory and respiratory complications of carbon dioxide insufflation. Dig Surg. 2004;21:95–105.
- Sharma Κ, Brandstetter R, Brensilver J, Jung L.Cardiopulmonary Physiology and Pathophysiology as a Consequence Of Laparoscopic Surgery. CHEST 1996; 110:810-15.
- Fink M , Heard S. Laboratory models of sepsis and septic shock. J Surg Research 1990; 49 : 186-196.
- Garrido A, Poli de Figueiredo L, Silva M. Experimental models of sepsis and septic shock: an overview. Acta Cirurgica Brasileira 2004; 19 : 82-8.
- Barnes G, Laine G, Giam P et al. Cardiovascular responses to elevation of intra-abdominal hydrostatic pressure. Am J Physiol 1985; 248 : 208-13.
- Skoog P, Horer T, Nilsson K et al. Intra-abdominal Hypertension An Experimental Study of Early Effects on Intra-abdominal Metabolism Ann Vasc Surg 2015; 29: 128–37.
- Skoog P, Horer T, Nilsson K et al. Abdominal Hypertension and Decompression: The Effect on Peritoneal Metabolism in an Experimental Porcine Study. European Journal of Vascular and Endovascular Surgery 2014; 47 Issue : 402 – 10.
- Odeberg-Wernerman S. Laparoscopic surgery: effects on circulatory and respiratory physiology: an overview. Eur J Surg Suppl. 2000;166:4–11.
- O’Malley C, Cunningham AJ. Physiologic changes during laparoscopy. Anesthesiol Clin North America. 2001;19:1–19.
- Atkinson Τ, Giraud G, Togioka B et al. Cardiovascular and ventilatory consequences of laparoscopic surgery. 2017;135:700–710.
- Ho H, Saunders C, Gunther R, Wolfe B. Effector of hemodynamics during laparoscopy: CO2 absorption or intra-abdominal pressure. J Surg Res. 1995;59: 497-503.
- Richardson J, Trinkle J. Hemodynamic and respiratory alterations with increased intra-abdominal pressure. J Surg Res. 1976;20:401–404.
- Joris J, Noirot D, Legrand M, Jacquet N, Lamy M. Hemodynamic changes during laparoscopic cholecystectomy. Anesth Analg 1993;76:1067-71.
- Kashtan J, Green JF, Parsons EQ, et al. Hemodynamic effect of increased abdominal pressure. J Surg Res 1981;30:249–55.
- Ridings P, Bloomfield GL, Blocher CR, et al. Cardiopulmonary effects of raised intra-abdominal pressure before and after intravascular volume expansion. J Trauma 1995;39 :1071–5.
- Funk D, Parrillo J, Kumar A. Sepsis and Septic Shock: A History. Crit Care Clin 2009; 25 : 83–101.
- Durairaj L, Schmidt G. Fluid Therapy in Resuscitated Sepsis Less Is More. CHEST 2008; 133:252–63.
- Rivers E, Nguyen B, Havstad S. Early goal-directed therapy in the treatment of severe sepsis and septic shock. N Engl J Med 2001;345:1368-77.
- Sugrue Μ. Abdominal compartment syndrome. Curr Opin Crit Care 2005 ; 11: 333—8.
- Lee R. Intra-abdominal Hypertension and Abdominal Compartment Syndrome : A Comprehensive Overview. Critical Care Nurse 2012; 32 : 19-32.
- Bailey J, Shapiro M. Abdominal compartment syndrome. Crit Care 2000, 4:23–9.
- Pinsky Μ. The right ventricle: interaction with the pulmonary circulation. Critical Care 2016; 20:266.
- Κimchi Α, Ellrodt G, Berman D et al. Right ventricular performance in septic shock: a combined radionuclide and hemodynamic study. JACC 1984; 4 : 945- 5.
- Vincent J-L, Reuse C, Frank N et al. Right ventricular dysfunction in septic shock: assessment by measurements of right ventricular ejection fraction using the thermodilution technique. Acta Anaesthesiol Scan 1989: 33: 34-38.
- Chan C, Klinger J. The right ventricle in sepsis. Clin Chest Med 2008 ; 29 : 661–76.
- Vonk-Noordegraaf Α, Haddad F, Chin K et al. Right heart adaptation to pulmonary arterial hypertension. physiology and pathobiology. Am Coll Cardiol 2013;62:22–33.
- Vonk Noordegraaf A, Westerhof B, Westerhof N. The relationship between the right ventricle and its load in pulmonary hypertension. J Am Coll Cardiol 2017;69:236–43.
- Naeije R, Manes A. The right ventricle in pulmonary arterial hypertension. Eur Respir Rev 2014; 23: 476–87.
- Pinsky M, Kellum J, Bellomo R. Central venous pressure is a stopping rule, not a target of fluid resuscitation. Crit Care Resusc 2014;16:245–6.
- Haddad F, Doyle R, Murphy D, Hunt S. Right Ventricular Function in Cardiovascular Disease, Part II: Pathophysiology, Clinical Importance, and Management of Right Ventricular Failure. Circulation. 2008;117:1717-1731.
- Rosenkranz S, Preston I. Right heart catheterisation: best practice and pitfalls in pulmonary hypertension. Eur Respir Rev 2015; 24: 642–52.
- Grignola J. Hemodynamic assessment of pulmonary hypertension. World J Cardiol 2011; 26 3 : 10-17.
- Chemla D, Castelain V, Herve P et al. Haemodynamic evaluation of pulmonary hypertension. Eur Respir J 2002; 20: 1314–31.
- Opitz C, Blind R, Blumberg F et al. Pulmonary hypertension: Hemodynamic evaluation. Updated Recommendations of the Cologne Consensus Conference 2011. International Journal of Cardiology 2011; 154 : 13–19.
- Opitz Ch, Hoepe M, Gibbs S et al. Pre-capillary, combined, and post-capillary pulmonary hypertension. A pathophysiological continuum. J Am Coll Cardiol 2016;68:368–78.
- Vachiery J, Adir Y, Barbera J et al. Pulmonary hypertension due to left heart diseases. J Am AColl Cardiol 2013;62:100–8.
- Hoeper M, Bogaard H, Condliffe R et al. Definitions and diagnosis of pulmonary hypertension. J Am Coll Cardiol 2013;62:D42–50.
- Galie N, Humbert M, Vachiery J et al. 2015 ESC/ERS guidelines for the diagnosis and treatment of pulmonary hypertension. Eur Heart J 2016;37:67–119.
- Gattinoni L, Brazzi L, Pelosi P, et al. A trial of goal-oriented hemodynamic therapy in critically ill patients. SvO2 Collaborative Group. N Engl J Med 1995;333:1025–32.
- Jones A, Puskarich M. Sepsis – Induced Tissue Hypoperfusion. Crit Care Clin 2009; 25 : 769–779.
- Rivers E, Coba V, Visbal A, et al. Management of sepsis: early resuscitation. Clin Chest Med 2008;29(4):689–704, ix–x.
- Casserly B, Richard Read R, Levy M. Hemodynamic Monitoring in Sepsis. Crit Care Clin 2009; 25: 803–823.
- Merx Μ, Weber C. Sepsis and the Heart. Circulation. 2007;116: 793-802.
- Kumar Α, Haery C, Parrillo Myocardial Dysfunction in Septic Shock: Part I. Clinical Manifestation of Cardiovascular Dysfunction. Journal of Cardiothoracic and Vascular Anesthesia 2001; 15 : 364-76.
- Kumar Α, Krieger Α, Symeoneides S, et al. Myocardial Dysfunction in Septic Shock: Part II. Role of Cytokines and Nitric Oxide. Journal of Cardiothoracic and Vascular Anesthesia 2001; 15 : 485-511.
- Kumar Α, Haery C, Parrillo Μyocardial dysfunction in septic shock. Critical Care Clinics 2000; 16 : 251-87.
- Hunter J, Doddi M. Sepsis and the heart. Br J Anaesth 2010; 104: 3–11
- Greer J. Pathophysiology of cardiovascular dysfunction in sepsis. BJA 2015;15 316–21.
Author Disclosures:
Authors Grosomanidis V., Veroniki F., Fyntanidou B., Tsiapakidou S., Kyparissa M., Kazakos G., Lolakos K., Kotzampassi K. have no conflicts of interest or financial ties to disclose.
Corresponding author:
Veroniki Foteini
Anesthesia and ICU Clinic AHEPA University Hospital, Thessaloniki, Greece
Eteokleous 32-34 54250 Thessaloniki
T: 0030 6932666101
E-mail:


