
Authors: Aslanidis Th.1 MD, PhD(c), Myrou A.2MD, PhD(c), Tsirona Ch.3 RN, MSc, PhD(c), Kontos A.4 MD, Giannakou-Peftoulidou M.5 MD, PhD
1Anesthesiologist – Intensivist, Mobile Intensive Care Units, National Center of Emergency Care, Thessaloniki Dep. ,Greece
2Internist-Intensivist, Private practice, Thessaloniki, Greece
3Registered Nurse, Renal Replacement Therapy Unit, “AHEPA” Univ. Hospital, Thessaloniki, Greece
4General surgeon- Intensivist, Intensive Care Unit, “Kyanous Stauros” Gen. Hospital, Thessaloniki, Greece
5Anesthesiologist – Intensivist, Intensive Care Unit, Department of anesthesia and critical care medicine, “AHEPA” Univ. Hospital, Thessaloniki, Greece
ABSTRACT
Trend towards noninvasive, easy to use monitor was always a challenge. Numerous indices have been used to monitor the progress of patients on positive pressure ventilation. The present study compares different indices in a mixed larger intensive care unit (ICU) population. In a prospective observational study Arterial blood gases (ABG) analyses were obtained from 225 patients under mechanical ventilation in a polyvalent adult ICU. Values of ideal body weight (IBW), Body mass index (BMI), PAO2, PaO2/FiO2 ratio (PFr), SpO2/FiO2 ratio (SFr), SpO2/PEEP ratio (SPr), SpO2/PaCO2 ratio (SPCr), Oxygenation index (OI) and Ventillatory ratio (VR) were calculated; and further correlation analysis was conducted. In Pressure control ventilation mode a relative strong relation between PFr and SFr and OI was found; yet further regression analysis implies that no direct replacement of PFr with SFr can be made without limitations, in clinical setting. In Volume control ventilation mode moderate relation was found between SFr and PFr. In the present study a moderate relation was found between SFr and PFr. The results agree with previous published studies; the differences among them lie in the different design of each one of them. The authors believe that- given the fact that one still considers using broadly PFr as index of oxygenation- SFr can be used safely as a surrogate for PFr only for certain disease states. Larger series are needed in order to define those patients groups and these pathophysiological conditions.
Introduction
Measures of oxygenation are traditionally used to monitor the progress of patients on positive pressure ventilation. Numerous indices have been such as the arterial to alveolar O2 difference, the intrapulmonary shunt fraction, the oxygen index and the PaO2/FiO2 ratio, the oxygenation index, the ventilatory ratio, etc. Of these different indices the PaO2/FiO2 ratio has been adopted for routine use because of its simplicity. This ratio is included in the Lung Injury Score1, the American–European Consensus Conference ARDS Definition2 and the ARDS Berlin definition3. Yet, even this index has problems such as the need of an arterial line in situ, the PEEP dependence and the nonlinear behavior in relation with FiO2 changes4.
Several authors have proposed different, often less invasive ways to monitor oxygenation or ventilation in patients in ALI. Such indices are SpO2/FiO2 (SFr)5, the already popular in pediatric populations Oxygenation Index (OI) (which is defined as FiO2),(Mean Airway Pressure / PaO2)6 and the Ventilatory ratio(VR). The latter compares actual measurements and predicted values of minute ventilation and PaCO2 and it is defined as (MVmeasuredx PaCO2 measured)/(MV predicted x PaCO2measured), where MV predicted is taken 100 ml.kg-1.min-1 based on predicted body weight and PaCO2measured is taken 37.5mmHg (5 kPa)7.Predicted Body Weight (kg) is calculated using the formula 50+0.91 (centimetres of height–152.4) for males, and 45.5+0.91 (centimetres of height–152.4) for females (ARDS Network calculator)8-9.
A previous smaller study identified a strong relation between PFr, SFr and OI but not VR not only in ALI patients; suggesting that these markers may be used interchangeably as bedside indices of oxygenation in critically ill patients10. The aim of the present study is to compare the aforementioned indices along with the SpO2/PaCO2 ratio (SPCr) and SpO2/PEEP ratio (SPr) in a mixed larger ICU population.
MATERIAL AND methods
During an 11 month period a prospective observational study was carried out in a polyvalent adult ICU. Since this was an observational study and arterial blood samples were taken as part of their standard therapy, there was no need for an approval of regional ethics committee. Arterial blood gases (ABG) analyses were obtained from 225 patients under mechanical ventilation: Pressure or Volume Control. Two independent measurements were taken from each patient under the same mode of ventilation. Demographic data (age, sex, body weight and BSA), APACHE score II, diagnosis, mode of ventilation and values of PaO2, PaCO2, FiO2, mean airway pressure-Pm, peak airway pressure- Pp, PEEP, Compliance (C), expiratory Resistance (Re), minute ventilation (MV), respiratory frequency (RR), tidal volume (Vt) and hemoglobin concentration (Hb) were recorded. Exclusion criteria were: age<18yr old, presence of chronic pulmonary disease (obstructive or restrictive), mechanical ventilation duration<24h, unstable clinical status 3h before and 3h after the time of measurement.
Values of ideal body weight (IBW), Body mass index (BMI), PAO2, PaO2/FiO2 ratio (PFr), SpO2/FiO2 ratio (SFr), SpO2/PEEP ratio (SPr), SpO2/PaCO2 ratio (SPCr), Oxygenation index (OI) and Ventillatory ratio (VR) were then calculated using MS Office Excel 2007.
Further statistical analysis (SPSS v.19 – IBM SPSS Inc., USA) included comparison of the two modes of ventilation, descriptive analysis and Shapiro-Wilk W test for normality of the data of every parameter. Relationships between the different indices were also explored. In case of a strong correlation (>0.80) and when applicable (assumption of normality), a regression analysis was performed for certain indices. Finally, residual analysis control of the prediction equation was conducted.
RESULTS
The mean age of all patients included in the study was 61.2 years old and the mean APACHE score was 15.4±1.8. Mean characteristics of the two groups are shown in table 1.
Table 1. Characteristics of the two groups
| Mode | APACHE II* | Age | Height* | Body weight* | Hb* | Ppeak* | Resp.Rate* | Compliance (static)* | Pmean | |
|---|---|---|---|---|---|---|---|---|---|---|
| PCV | Mean | 15.9 | 62.9 | 176.13 | 83.22 | 27.6 | 29.44 | 12.94 | 47.75 | 15.31 |
| SD | 2.3 | 15.3 | 10.55 | 12.79 | 4.6 | 4.23 | 4.20 | 16.79 | 2.47 | |
| VCV | Mean | 14.4 | 57.9 | 172.86 | 81.11 | 26.9 | 27.62 | 11.86 | 48.99 | 13.77 |
| SD | 1.7 | 18.0 | 11.04 | 15.29 | 5.2 | 4.37 | 2.88 | 11.83 | 1.97 | |
The distribution of the patients according to diagnosis and the distribution of the ABG samples based on the mode of mechanical ventilation are displayed in Figure 1.
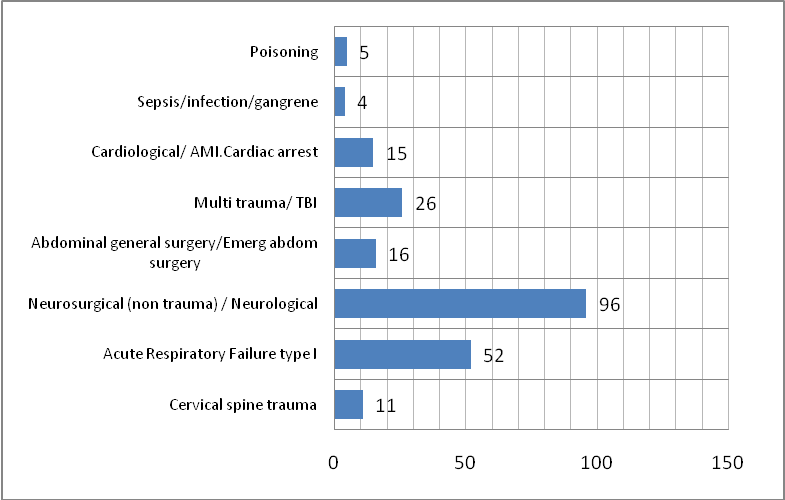
Figure 1. A) Distribution of patients based on diagnosis

Figure 1. B) Distribution of ABG samples based on mode of ventilation.
Distribution of patients based on sex, diagnosis and mode of ventilation is shown in Figure 2. Descriptive statistics of the seven parameters of interest are displayed in table 2.
Figure 2.Distribution of patients by diagnosis, sex and mode of ventilation.
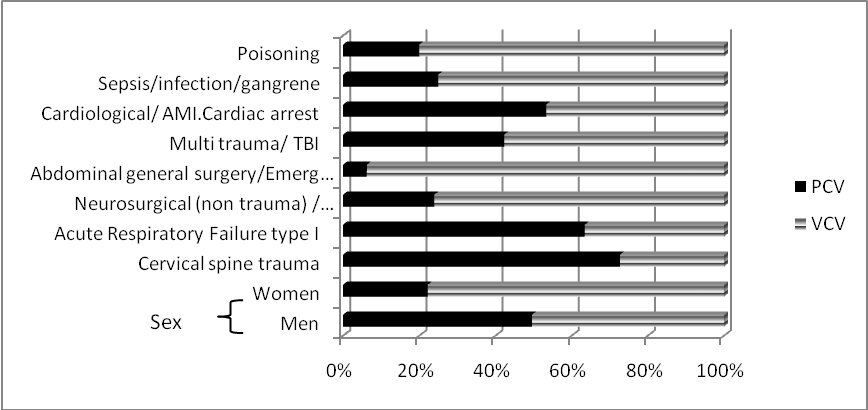
Figure 2. Distribution of patients by diagnosis, sex and mode of ventilation.
Table 2. Descriptive statistics of selected parameters (rounded to two decimals).
| PEEP | SpO2/FiO2 % ratio | PaO2/FiO2 % ratio | Oxygenation Index | |||||
|---|---|---|---|---|---|---|---|---|
| Mode | PCV | VCV | PCV | VCV | PCV | VCV | PCV | VCV |
| Mean | 9.65 | 6.9 | 168.14 | 211 | 212.56 | 310 | 9.33 | 4.28 |
| SEM | 0.21 | 0.13 | 5.95 | 3.99 | 10.56 | 10.86 | 0.61 | 0.17 |
| Median | 10 | 7 | 163.33 | 240 | 200.43 | 291. | 7.78 | 4.05 |
| SD | 1.9 | 1.53 | 55.19 | 46.56 | 97.98 | 126.1 | 5.72 | 2.01 |
| Ventilatory Ratio | SpO2/PEEP ratio | SpO2/PaCO2 ratio | ||||
|---|---|---|---|---|---|---|
| Mode | PCV | VCV | PCV | VCV | PCV | VCV |
| Mean | 1.62 | 1.35 | 10.67 | 15.02 | 2.38 | 2.62 |
| SEM | 0.057 | 0.030 | 0.27 | 0.28 | 0.05 | 0.03 |
| Median | 1.64 | 1.30 | 9.58 | 14.14 | 2.37 | 2.60 |
| SD | 0.53 | 0.35 | 2.55 | 3.35 | 0.49 | 0.37 |
Correlations between the parameters of interest are displayed in table 3. Coefficients (Spearmann or Pearson) are chosen according to normality test results. Different relations are noticed for different modes of ventilation.
Table 3. Significant (p<0.05 two tailed) and moderate/strong (Spearmannρ>0.6) correlations between the selected parameters.
| VCV | PEEP | SFr | SPCr | PFr | SPr | OI | VR |
|---|---|---|---|---|---|---|---|
| PEEP | W | W,NS | W | -0.97§ | W | W,NS | |
| SFr | W | W | 0.616 | W | -0.627 | W,NS | |
| SPCr | W,NS | W | W | W | W | W | |
| PFr | W | 0.63 | W | W | -0.742 | W,NS | |
| SPr | -0.97§ | W | W | W | W | W | |
| OI | W | W | W | -0.742 | W | W,NS | |
| VR | W,NS | W,NS | W | W,NS | W,NS | W,NS |
Further regression analysis (when applicable) revealed that in PCV mode only 72.7% of SFr change and 92.8% of OI change can be explained by PFr change; yet, in VCV mode no regression analysis could be conducted (figure 3).
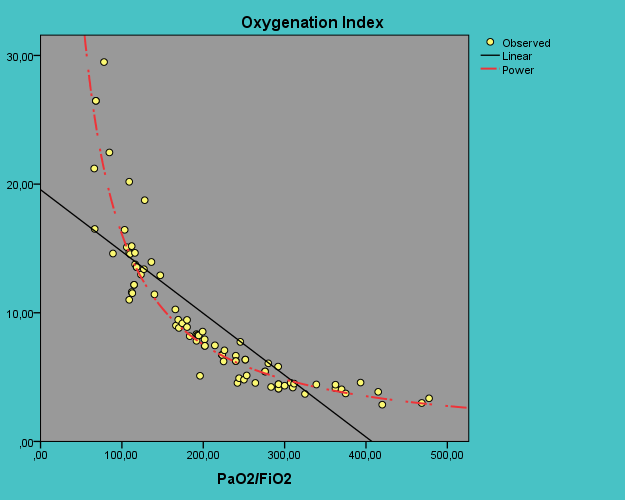
Figure 3. Regression analysis in PCV mode.
OI = 2515.1 x PFr^-1.096, R2=0.928 (p<0.05)
SFr = 7,12 x PFr^0.592, R2=0.736 (p<0.05)

Figure 3. Regression analysis in PCV mode.
OI = 2515.1 x PFr^-1.096, R2=0.928 (p<0.05)
SFr = 7,12 x PFr^0.592, R2=0.736 (p<0.05)
DISCUSION
The ideas of using SpO2 instead of PaO2 and the possibility of replacing an invasive index (PFr) with a non-invasive index (SFr) are not new. The larger study comes from Rice et al. (2613 measurements), who report that SFr of 235 and 315 correlate (r=0.89, p<0.001) with PFr of 200 and 300 (SFr = 64+0.84x (PFr), respectively, for diagnosing and following up adult patients with ALI and ARDS5. In children, Pandharipande et al. found that the total and respiratory SOFA scores obtained with imputed SF values correlate (ρ~0,85, p<0.001) with the corresponding SOFA score using PF ratios. Both the derived and original respiratorySOFA scores similarly predict outcomes11.Their patients were either undergoing general anesthesia or were part of the ARMA study8, they did not incorporate covariates such as hemoglobin, age, comorbid illnesses, smoking history, body mass index and positioning of patient (supine versus prone).
In our study, general characteristics of the 2 groups were comparable (both BMI and hemoglobin), with the exception of age and Pmean. All patients were supine; yet, we also did not incorporate comorbid illness and smoking history. The difference of Pmean is affected by the different values of PEEP for each group (table 2). The inhomogeneity of the mechanical ventilation mode distribution among various diagnoses is dominant. Yet, as we did not conduct any diagnosis – based analysis, we did not take this kind of differences in account. In PCV mode a relative strong relation between PFr and SFr and OI was found; yet further regression analysis implies that no direct replacement of PFr with SFr can be made without limitations, in clinical setting. In VCV mode moderate relation was found between SFr and PFr, though no regression analysis was conducted. The above findings may reflect the different characteristics between the 2 groups (diagnosis, number of samples). No correlation was found between the other indices.
Hence; at first sight, it appears that the correlation between SFr and PFr is difficult to be applied in everyday clinical setting. Why? We suggest that the reason is the relation SpO2 to PaO2.
Numerous mathematical models that have been proposed to describe the standard and nonstandard HbO2‘‘equilibrium’’ dissociation curves since the pioneering work of Hill and Adair12-13. From the relatively “simple” Severinghous equation to the empirical equations of Kelman and Siggaard-Andersen; Thomas modification and, the more complex, mathematical computational models of Easton, Buerk-Bbridges and Nickalls, the aim is to reliably calculate SpO2 from PaO2 and vice versa– i.e. to replace PFr with SFr for a given FiO213-20. Yet, data of these models come mainly from subjects (human and animals) with “normal” physiology. In addition, each model has its drawbacks, the detailed reference of which is beyond the scope of this article. Large series of arterial blood samples from Gøthgen et al and Sommers and al. only confirm the complexity of the problem20-21.
Finally, another issue is the overall clinical relevance of the PFr. Since PFr has a lot of limitations: PEEP dependence, nonlinear behavior of PFr in dependence of FiO2, etc3-4, are we trying in vain to replace a poor index of oxygenation with another maybe less reliable? The authors of this study agree with former reports that “accuracy should be balanced with feasibility”23. We do need a mathematical model complex enough to reliably reflect gas exchange in lung disease state, but simple enough to use; or more than one model that can be used under certain conditions.
However, seek for a noninvasive index in place of an invasive or seek for the conditions that this replace could be applied are not vain. Till the time of the writing of this article (Dec 2014) PFr is one of the most used and popular index; that why we should continue the research in order to find the conditions that they‘ll allow us to use a noninvasive index (SFr) instead.
CONCLUSION
In the present study a moderate relation was found between SFr and PFr. The results agree with previous published studies; the differences among them lie in the different design of each one of them. The authors believe that- given the fact that one still considers using broadly PFr as index of oxygenation- SFr can be used safely as a surrogate for PFr only for certain disease states. Larger series are needed in order to define those patients groups and these pathophysiological conditions.
Author Disclosures:
Authors Aslanidis Th., Myrou A., Tsirona Ch., Kontos A.,Giannakou-Peftoulidou M. have no conflicts of interest or financial ties to disclose.
Corresponding Author:
Theodoros Aslanidis,
4 Doridos street, PC 54633,
Thessaloniki, Greece,
tel.: +306972477166,
e-mail:


